One of the most important statistical tests that you can perform is the chi square test. However, before you actually do the test, you need to ensure that you know how to calculate the chi square by using the right chi square formula.

The main goal of performing a chi square test is to analyze if there is a relationship between the observed frequency and the expected frequency. Any chi square test that you perform will always assume that the null hypothesis is that there is no relationship between the two variables, meaning that they are independent.
Discover everything you need to know about the chi square table.
One simple example of a chi square test was to determine the relationship between political party membership and the intention to vote, for example.
The Chi Square Formula
While the chi square formula and all the chi square tests that you can perform are usually made using a computer and special software, the reality is that it is important that you know the formulas as well as what they mean. After all, when you finally get to a result, it will be easier for you to interpret the result.
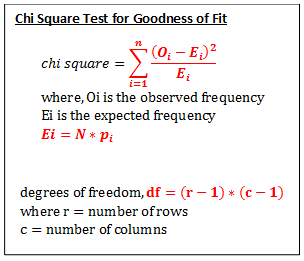
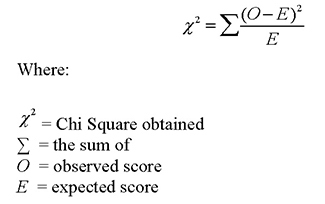
In order to calculate the Chi Square Statistic value, you need to use the following formula:
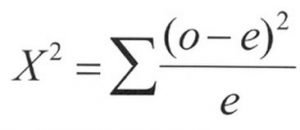
where:
X^2 = chi square value
O = observed frequency
e = expected frequency
As you can easily conclude, the chi square statistic is dependent on the difference between the observed data and the expected data.
Using The Chi Square Formula – A Practical Example
While, as we already said above, you probably won’t need to do any of these calculations by hand, it is important that you know how the entire process works so that it can be easier for you to reach conclusions and analyze your results correctly.
So let’s say that you have the following data and that you need to calculate the chi square statistic:
| Color | Red | Green | Yellow |
|---|---|---|---|
| Observed frequency | 12 | 16 | 20 |
| Expected frequency | 16 | 8 | 25 |
All you need to do is to follow the next steps:
#1: The first thing you will need to do is to subtract the expected number to the observed number in the table. So, basically, you will be determining the ( O – E ):
– For the red color: (O−E) = (12−16) = 4
– For the green color = (O−E) = (16−8) = 8
– For the yellow color = (O−E) = (20−15) = 5
Take a look at the best way to use a t distribution table.
#2: Now, you will need to determine the square the difference: ( O – E )^2:
– For the red color: 4^2 = 16
– For the green color = 8^2 = 64
– For the yellow color = 5^2 = 25
#3: In this step, you will need to divide the values that you obtained in the previous step by their respective expected number: [ (O – E)2 / E ]

– For the red color: 16 / 4 = 4
– For the green color = 64 / 8 = 8
– For the yellow color = 25 / 15 = 5 / 3 = 1.667
#4: In this last step, you just need to sum all the values you got in the previous step to discover the chi square statistic:
X^2 = 4 + 8 + 1.667 = 13.667