One of the most common chi square tests that you may perform is the chi square goodness of fit test.
This test starts by hypothesizing hat the distribution of a variable behaves in a specific way. Here’s an example. Let’s say that the manager of a store wants to know the daily staffing needs of a retail store. In order to know this, the manager may also want to find out whether the number of customers is equal each day of the week.
Discover everything you need to know about the chi square value.
So, to begin a chi square goodness of fit test, the manager needs to state the first hypothesis, the null hypothesis. In this case, he assumes that the number of customers in the store each day are equal.
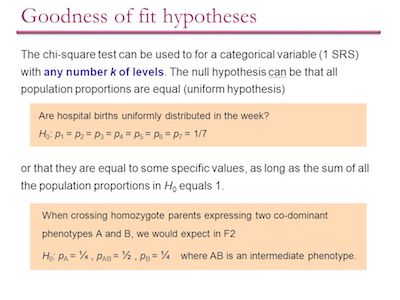
Here’s a different example. A student may look at the set of grades for a class and he may suspect that the teacher allocated the grade on the basis of a normal distribution. But there is a different possibility. The researcher may claim that the sample that was selected has a distribution that is very close to the distribution of the population.
It’s important to keep in mind that no general statement can be provided to cover all these possibilities. But there is a common element: the claim is made concerning the nature of the whole distribution.
Discover how to calculate the chi square value.
Chi Square Goodness Of Fit Test – A Technical Overview
Let’s say that you have a variable that has a frequency distribution with k categories into which the data has been grouped. Notice that these frequencies of occurrence of the variable for each category of the variable are known as observed values.
So, when you want to use the chi square goodness of fit test, you need to determine how many cases there would be in each category if the sample data were distributed exactly according to the claim. And these are known as the expected number of cases for each category.
One of the things that you need to know is that the total of the expected number of cases is always equal to the total of the observed number of cases. And this allows you to get both the null hypothesis as well as the alternative hypothesis.
Looking for a chi square calculator?
- Null Hypothesis: The observed number of cases in each category is exactly equal to the expected number of cases in each category.
- Alternative Hypothesis: The observed and expected number of cases differ sufficiently to reject the null hypothesis.
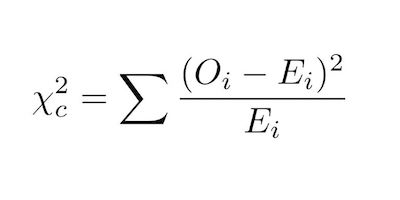
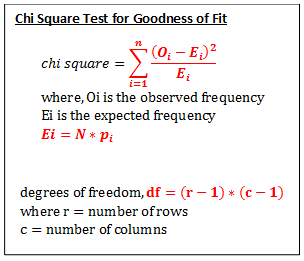
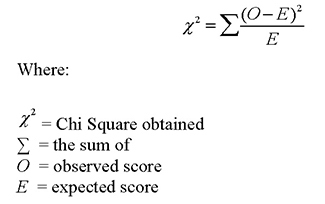
Where:
Oi = the observed number of cases in category i
Ei = the expected number of cases in each category, for each of the k categories i = 1, 2, 3, · · · , k, into which the data has been grouped
Notice that there are k – 1 degrees of freedom.
Make sure to use our chi square calculator.
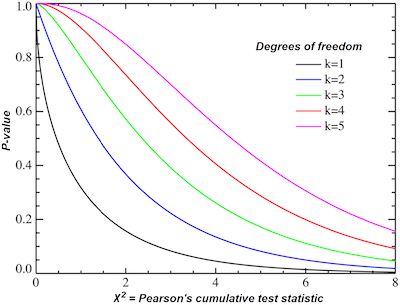
When you get a large value, this means that you will need to reject the null hypothesis. On the other hand, when you get a small value, you won’t be able to reject the null hypothesis.
The chi square distribution with k − 1 degrees of freedom is used to determine the critical χ 2 value for the test. This sketch of the test should allow you to follow the first example of a chi square goodness of fit test.