The chi square statistic is very used in statistics when you need to test relationships between categorical variables.
As you probably already know, when you need to perform a statistics test, you always have two different hypotheses. And the chi square test is no different. In this particular case, the null hypothesis is that there isn’t a relationship between the categorical variables in the population. So, ultimately, this means that they are independent.
How The Chi Square Statistic Works

As we already mentioned above, the chi square tests have the ultima goal of showing that two categorical variables are independent. So, it is normal to see the chi square statistic being used to evaluate Tests of Independence when using crosstabulation.
In case you don’t know what crosstabulation is, you just need to keep in mind that it shows the distributions of two categorical variables at the same time, with the intersections of the categories of the variables appearing in the cells of the table.
The main goal of the Test of Independence is to determine whether an association exists between the two variables that you have. And it does this by comparing the observed pattern of responses in the cells to the pattern that would be expected if the variables were truly independent of each other.
Check out our unique chi square calculator.
So, when you calculate the chi square statistic and you compare it against a critical value of the chi square distribution, then the researcher will be able to know if the observed cell counts are significantly different from the expected cell counts.
Calculating The Chi Square Statistic
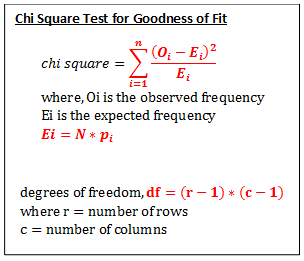
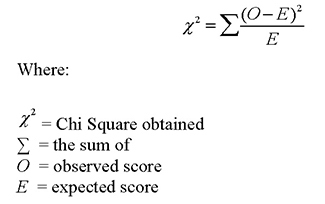
When you are looking to calculate the chi square statistic, you need to use the following formula:
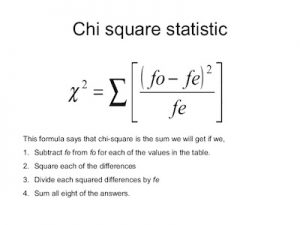
where:
fo = the observed frequency (the observed counts in the cells)
fe = the expected frequency if no relationship existed between the variables
As you can easily understand by looking at the formula, the chi square statistic is based on the difference between what is actually observed in the data and what would be expected if there was truly no relationship between the variables.
Make sure to use our chi square calculator.
Determining The Chi Square Statistic In SPSS & Its Interpretation
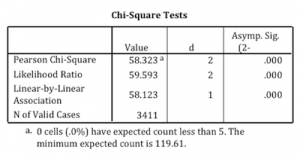
When you request a crosstabulation in SPSS, the chi square statistic will appear as an option. You also need to know that the output is named chi square tests and that the Chi-Square statistic used in the Test of Independence is labeled Pearson Chi-Square.
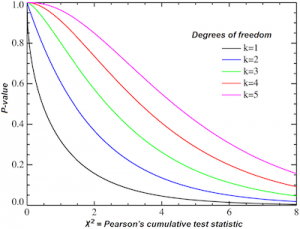
Notice that the chi square statistic can be evaluated by simply comparing the actual value against a critical value that is found in a chi square distribution. In addition, you should also take into consideration that the degrees of freedom are calculated as # of rows – 1 x # of columns – 1).
Looking for a good calculator to determine the chi square value?
So, how can you withdraw a conclusion?
When you want to make a conclusion about the hypothesis with 95% confidence, the value labeled Asymp. Sig. (which is the p-value of the Chi-Square statistic) should be less than .05 (which is the alpha level associated with a 95% confidence level).
Is the p-value (labeled Asymp. Sig.) less than .05? If so, we can conclude that the variables are not independent of each other and that there is a statistical relationship between the categorical variables.
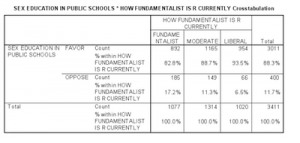
In this example, there is an association between fundamentalism and views on teaching sex education in public schools. While 17.2% of fundamentalists oppose teaching sex education, only 6.5% of liberals are opposed.
The p-value indicates that these variables are not independent of each other and that there is a statistically significant relationship between the categorical variables.